Blaseball Not-So-Grand Siesta’s Speed Dating: Team Capsule Rundown and Review
  Flying Wild High – AWAY GAMES
  Season 2 (CE) Blaseball MVP Vote Results: Who's Top with Two In The Books?
  Season 2 Blaseball Election: What Happened?


Blaseball News Network: Closing Thoughts: The BNN Community Closes Out
Earlier this month, after a surprise announcement, Blaseball closed the league down permanently. Players have been Released, betting ended for...
Earlier this month, after a surprise announcement, Blaseball closed the league down permanently. Players have been Released, betting ended for...

The ledger on old Blaseball history is now closed. Its pages are frayed, torn, and smudged with fingerprints, but at...

https://youtu.be/AxqkKETWsz4 Audio version available on the BNN YouTube. The return of a grand tradition happened in season NEW 2, folks!...

https://youtu.be/9qNo6koyVSw Audio version available on the BNN YouTube. Season 2 of the Coronation Era is officially notarized and in the...

written by Thraen Boat of Atlantis With the Moab Hellmouth Sunbeams’ Golden Record Notarized and the election complete, Season 2...

https://youtu.be/Ai0Ecle4sI8 Audio version available on the BNN YouTube. Season CE2 of Blaseball brought us the meteoric rise of the now...
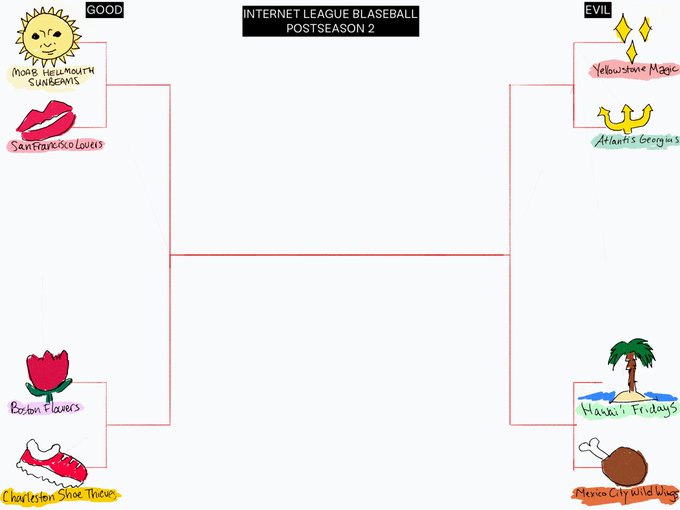
If you’re like us, you were confused by the schedule of the Blaseball Season CE2 Postseason. When you figured out...

Wow. That really did happen. Everyone said we'd be the best and then… we… were the best? Honestly that was...
This week, it was a good idea to get out of Moab. I'd estimated the Beams (because it's my job),...

https://www.youtube.com/watch?v=SIfzIAo-UBU Audio version available on the BNN YouTube page. I am sure if you asked any Sunbeams fan how they're...